The pandemic and the evolution of the real estate market during the last few years didn’t suppress Millennials’ appetite for buying forever homes. On the contrary, most Millennials are now sipping their matchas in their own homes rather than in rentals.
This demographic gained 10.8 million homeowners in the last decade, including 7.1 million in the last five years to reach 18.2 million in 2022. This boost tipped the balance in favor of homeownership and made Millennials an owner-majority generation with a share of 51.5%. As a result, this demographic (also known as generation Y) passed the renter-majority torch to Zoomers: The Gen Z cohort gained nearly 4.5 million renters in the last five years, leading to a renter share of 74%, while all the other generations lost renters. Clearly, Gen Zers are now coming of age and becoming a significant market for apartment builders, reaching 5.6 million renter households in 2022. Click on the arrows below to see how the number of owners and renters evolved for each generation in the last three decades. 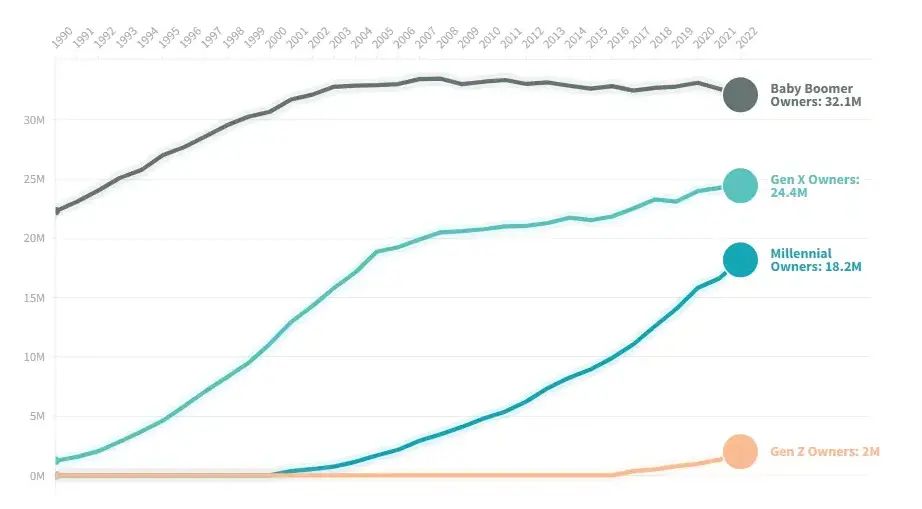
To get a clearer view of generational trends in homeownership and renting across the country, we analyzed IPUMS data for the nation’s 110 largest metros (with populations of 500,000 or more). In more than a quarter of these metros, the number of Millennial owners doubled between 2017 and 2022.
The average Millennial homeowner bought their first home at 34 years old, later than their parents or grandparentsDue to housing affordability as well as generational values, homeownership happened later in life for Millennials than for Gen Xers or Baby Boomers. When Millennials became an owner-majority generation in 2022, the average Millennial was 34. Gen Xers reached the milestone in 2003, at an average age of 32. Boomers crossed this threshold in 1987, at the average age of 33. The idea of the American Dream has begun to distance itself from the picket fence narrative. That’s because Millennials are living by other principles and values than their parents or grandparents. However, despite the growing popularity of the renter-by-choice lifestyle, America’s largest adult generation is now mostly made up of homeowners. Whether they bought a home to start a family or as an investment, this demographic cohort counts 18.2 million homeowners and nearly 17.2 million renters. By comparison, Baby Boomers are the largest group of homeowners at 32.1 million versus 9.1 million renters. Family support fueled homebuying for MillennialsBetween 2017 and 2022, the number of Millennial homeowners increased by a whopping 64% to 18.2 million. The staggering addition of 7.1 million households exceeded the number added by all the other generations combined. Gen X recorded only 1.9 million new owner households in the last five years, while Baby Boomers saw a decline of 354,000 within the same timeframe. For Gen Z, the total number of homebuyers rose by 1.6 million between 2017 and 2022, representing a 455% jump, the highest among all demographic groups we analyzed. Still, homeownership in the U.S. was dominated by Boomers, who totaled 32.1 million owners, followed by Gen X with 24.4 million owner households. Renters vs. Owners: Five-Year Changes in Number of Households 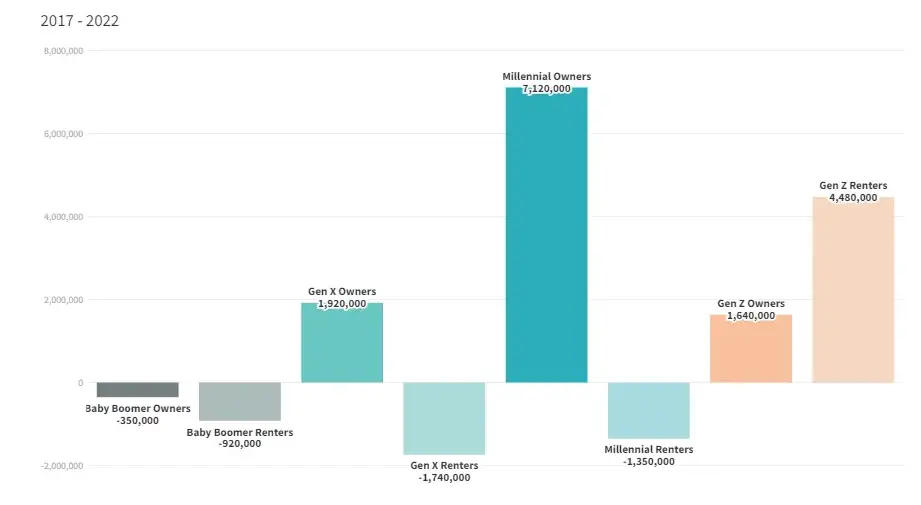
Millennials, who are now in their prime homebuying years, had several economic factors working to their benefit in the last few years, which helped make their picket fence dreams come true. First, Gen Y reached a historically high median income in 2022: $108,000 per year, up 44% compared to five years earlier. This was the most significant income increase among all generations. Gen Z came in next with a 33% rise in median income, followed by Gen X with 25%. Boomers saw an 8% jump.
Second, many moved back in with their parents during the pandemic or delayed moving out entirely. With work-from-home supporting these decisions, many Millennials saw this period as an opportunity to save for a down payment. As a bonus, 59% of Millennial homebuyers also received financial support from their parents for their mortgage down payment, according to a LendingTree survey. At the same time, the median home price in the U.S. has been on a steady steep climb ever since the lockdown, going from $322,600 in the spring of 2020 to $454,900 in the summer of 2022, according to the Federal Reserve Bank of St. Louis. However, this didn’t slow the housing market as anticipated. In 2020, the number of Millennial homeowners increased by 12.6% compared to 2019. In addition, despite the record-breaking home prices during the pandemic, the number of Millennial homeowners rose by almost 30% between 2019 and 2022. Only Zoomers had a more impressive rise in homeownership in the last three years (157%), but this is to be expected as this cohort is now coming of age and establishing itself in the job market. Five-Year Changes in Number of People Living in Multigenerational Households by Generation 
When it comes to renting, only Gen Z saw an increase in the last five years — up by 391% (an addition of nearly 4.5 million renters) to a total of 5.6 million. Millennials lost close to 1.4 million renters in the same timeframe but nevertheless remained the dominant demographic in the renting market with a total of 17.1 million households in 2022. Gen X was next with 10.6 million renters, followed by Boomers with 9.1 million.
Renters vs. owners in America’s largest metros: Millennials homeowners go for New York, but renters prefer L.A. Below, we list the changes in renting and owning by generation in the nation’s 50 largest urban areas, starting with New York, Los Angeles, Chicago, Houston and Dallas. #1 New York The number of Millennial homeowners in New York increased by 90% in the last five years, despite the median home sale price in the metro remaining above the $600,000 threshold since 2018. When it comes to renting, the area's rich cultural scene and dynamic tech business environment led to an 892% rise in Zoomer renters during the last five years. All of the other generations we looked at lost renters in New York, including Millennials (-0.3%). #2 Los Angeles In that same timeframe, Millennial homeownership jumped 47% in Los Angeles, while Millennial renters grew by 6.8%. By contrast, in more than half of the nation’s 50 largest metros, the number of Millennial renters decreased. The West Coast metro was also attractive for the younger demographic. More precisely, the number of Zoomer renters in Los Angeles increased by 82% in the last five years. Yet, while this may seem like a significant jump, it was still considerably lower than the gains in the country's other large metros. #3 Chicago Chicago was preferred by young professionals looking to settle down in a major metro. One of the reasons that may have led to the trend was the 36% income increase in Chicagoland in the last five years, according to IPUMS data. Between 2017 and 2022, the metro recorded a 75.6% rise in Millennial homeowners. That said, there were also 7% fewer Millennial renters and 25% fewer Boomer renters in Chicago than there were five years prior. #4 Houston Down south, Houston gained homeowners in all but one generation in the last five years (Baby Boomer owners decreased by 1.6%). Specifically, the number of Millennial owners rose by 52%, while Texas’ largest metro saw a 15% decline in Millennial renters. In addition, there were 38% fewer Boomers living in rental apartments in Houston. On the other hand, the metro gained Gen Z (a 541% rise) and Gen X renters (12%). #5 Dallas In addition, Dallas’ tech town appeal convinced a significant amount of young talent to choose it for buying a forever home. The metro saw a 64% gain in Millennial homeowners between 2017 and 2022 and a mere 4.5% uptick in Millennial renters. The number of Gen Zers who bought a home in Dallas grew five times in that same timeframe, while the number of Zoomer renters multiplied seven times. Surprisingly, the area was also popular for Baby Boomers. Dallas saw a 5% rise in Boomer homeowners and an 18% increase in Boomer renters in the last five years. Millennial homeownership is rising the most in Richmond, VA As we zoomed in on the most notable changes in the nation’s 50 largest urban hubs, Richmond, VA, stood out. Here, the number of Millennial homeowners tripled in the last five years -- the most significant rise in Millennial homeownership among the country’s largest 50 metros. The area’s funky, hipster reputation and cost of living below the state and national averages were two of the main reasons that drew in Millennials looking to buy a home. Las Vegas occupied the second spot with a 158% jump in homeownership for the same demographic cohort, followed by Milwaukee with 157%. Cincinnati was at the other end of the spectrum with a 16% decrease in Millennial owners. Cleveland; Raleigh, NC; San Jose, CA; and San Diego were the cities with the highest increases in the number of Millennial renters between 2017 and 2022 — 85% for the first two and close to 50% for San Diego and Silicon Valley’s largest metro area. Florida might be the state with the most attractive cities for renters, but many cities in the Sunshine State saw decreases in their renting population in the last five years: Millennial renters in Atlanta; Tampa, FL; Cincinnati; and Jacksonville, FL, decreased by more than one-third, the most out of all the 50 largest metros. Florida’s smaller metros are gaining Millennial homeowners at full tilt Expanding our analysis to 110 metros, we noticed that the number of Millennial homeowners more than doubled in 29 of the areas we looked at. The top two metros by the rise in Millennial homeownership were Modesto, CA, where it increased 24 times in the last five years, and North Port, FL, where it rose eight times. Overall, the Sunshine State was the #1 choice for Millennials looking to buy a home. Namely, Port St. Lucie, Lakeland-Winter Haven and Pensacola were also at the top of the list with rises in Millennial homeownership ranging from 507% to 217%. Our list of metros where Millennial homeownership more than doubled also included Bakersfield, CA; Youngstown, OH; Deltona, FL; Greensboro, NC; Portland, OR; Akron, OH; Omaha, NE; Atlanta; San Antonio; Grand Rapids, MI; Jacksonville, FL; Des Moines, IA; Orlando, FL; Austin, TX; Memphis, TN; and Bridgeport, CT. Granted, experts predict that the year ahead will be a slow one for home sales, mainly because the economy is in a phase of transition. This will likely encourage renting, which should continue to be the first housing option for many, particularly for Zoomers.  House Zero in Austin, Texas, is a 2,000-square-foot home that was built with 3D-printed concrete. Lake Flato Architects In architecture, new materials rarely emerge. For centuries, wood, masonry and concrete formed the basis for most structures on Earth. In the 1880s, the adoption of the steel frame changed architecture forever. Steel allowed architects to design taller buildings with larger windows, giving rise to the skyscrapers that define city skylines today. Since the industrial revolution, construction materials have been largely confined to a range of mass-produced elements. From steel beams to plywood panels, this standardized kit of parts has informed the design and construction of buildings for over 150 years. That may soon change with advances in what’s called “large-scale additive manufacturing.” Not since the adoption of the steel frame has there been a development with as much potential to transform the way buildings are conceived and constructed. Large-scale additive manufacturing, like desktop 3D printing, involves building objects one layer at a time. Whether it’s clay, concrete or plastic, the print material is extruded in a fluid state and hardens into its final form. As director of the Institute for Smart Structures at the University of Tennessee, I’ve been fortunate to work on a series of projects that deploy this new technology. While some roadblocks to the widespread adoption of this technology still exist, I can foresee a future in which buildings are built entirely from recycled materials or materials sourced on-site, with forms inspired by the geometries of nature. Promising prototypes Among these is the Trillium Pavilion, an open-air structure printed from recycled ABS polymer, a common plastic used in a wide range of consumer products. The structure’s thin, double-curved surfaces were inspired by the petals of its namesake flower. The project was designed by students, printed by Loci Robotics and constructed on the University of Tennessee Research Park at Cherokee Farm in Knoxville. Other recent examples of large-scale additive manufacturing include Tecla, a 450-square-foot (41.8-square-meter) prototype dwelling designed by Mario Cucinella Architects and printed in Massa Lombarda, a small town in Italy.  Tecla was built from locally sourced clay. Mario Cucinella Architects The architects printed Tecla out of clay sourced from a local river. The unique combination of this inexpensive material and radial geometry created an energy-efficient form of alternative housing. Back in the U.S., the architecture firm Lake Flato partnered with the construction technology firm ICON to print concrete exterior walls for a home dubbed “House Zero” in Austin, Texas. The 2,000-square-foot (185.8-square-meter) home demonstrates the speed and efficiency of 3D-printed concrete, and the structure displays a pleasing contrast between its curvilinear walls and its exposed timber frame. The planning process Large-scale additive manufacturing involves three knowledge areas: digital design, digital fabrication and material science. To begin, architects create computer models of all the components that will be printed. These designers can then use software to test how the components will respond to structural forces and tweak the components accordingly. These tools can also help the designer figure out how to reduce the weight of components and automate certain design processes, such as smoothing complex geometric intersections, prior to printing. A piece of software known as a slicer then translates the computer model into a set of instructions for the 3D printer. You might assume 3D printers work at a relatively small scale – think cellphone cases and toothbrush holders. But advances in 3D printing technology have allowed the hardware to scale up in a serious way. Sometimes the printing is done via what’s called a gantry-based system – a rectangular framework of sliding rails similar to a desktop 3D printer. Increasingly, robotic arms are used due to their ability to print in any orientation. Robotic arms allow for more flexibility in the construction process. The printing site can also vary. Furnishings and smaller components can be printed in factories, while entire houses must be printed on-site. A range of materials can be used for large-scale additive manufacturing. Concrete is a popular choice due to its familiarity and durability. Clay is an intriguing alternative because it can be harvested on-site – which is what the designers of Tecla did. But plastics and polymers could have the broadest application. These materials are incredibly versatile, and they can be formulated in ways that meet a wide range of specific structural and aesthetic requirements. They can also be produced from recycled and organically derived materials. Inspiration from nature Because additive manufacturing builds layer by layer, using only the material and energy required to make a particular component, it’s a far more efficient building process than “subtractive methods,” which involve cutting away excess material – think milling a wood beam out of a tree. Even common materials like concrete and plastics benefit from being 3D-printed, since there’s no need for additional formwork or molds. Most construction materials today are mass-produced on assembly lines that are designed to produce the same components. While reducing cost, this process leaves little room for customization. Since there is no need for tooling, forms or dies, large-scale additive manufacturing allows each part to be unique, with no time penalty for added complexity or customization. Another interesting feature of large-scale additive manufacturing is the capability to produce complex components with internal voids. This may one day allow for walls to be printed with conduit or ductwork already in place. In addition, research is taking place to explore the possibilities of multi-material 3D printing, a technique that could allow windows, insulation, structural reinforcement – even wiring – to be fully integrated into a single printed component. One of the aspects of additive manufacturing that excites me most is the way in which building layer by layer, with a slowly hardening material, mirrors natural processes, like shell formation.  A 3D-printed house in Shanghai that was built in less than 24 hours out of construction waste. This opens up windows of opportunity, allowing designers to implement geometries that are difficult to produce using other construction methods, but are common in nature. Structural frames inspired by the fine structure of bird bones could create lightweight lattices of tubes, with varying sizes reflecting the forces acting upon them. Façades that evoke the shapes of plant leaves might be designed to simultaneously shade the building and produce solar power. Overcoming the learning curve Despite the many positive aspects of large-scale additive manufacturing, there are a number of impediments to its wider adoption. Perhaps the biggest to overcome is its novelty. There is an entire infrastructure built around traditional forms of construction like steel, concrete and wood, which include supply chains and building codes. In addition, the cost of digital fabrication hardware is relatively high, and the specific design skills needed to work with these new materials are not yet widely taught. In order for 3D printing in architecture to become more widely adopted, it will need to find its niche. Similar to how word processing helped popularize desktop computers, I think it will be a specific application of large-scale additive manufacturing that will lead to its common use. Perhaps it will be its ability to print highly efficient structural frames. I also already see its promise for creating unique sculptural façades that can be recycled and reprinted at the end of their useful life. Either way, it seems likely that some combination of factors will ensure that future buildings will, in some part, be 3D-printed.  A 3D-printed façade in Foshan, China. The Association for Computer Aided Design in Architecture  Nearly every organization of size struggles with it. The trouble starts when you start asking people what DT actually means. What is it, exactly? And people kinda scratch their heads. It’s hard to nail down. This lack of mental traction is because of, we think, poor word choice. “Transformation” is not really a word people use to describe everyday life. Nobody ever gets out of bed in the morning and says, “I’m going to transform myself today!!!” It’s more like a word out of a superhero movie. By itself, it sounds ridiculous. What people are really talking about, in more everyday language, is “Change”. Because as the image says, “change” is the Alpha and Omega of business. All DT is, then, is using technology to create and manage change at an ever more accelerated and effective rate. For all the technical wizardry and big-budget enterprise software associated with DT, it’s really just common sense more than anything else. The other thing to remember, of course, is that technology is not the problem, people are the problem. Many, if not most, DT initiatives fail, and they fail mainly because of cultural issues i.e. human beings. Culture is key to DT because all roads lead back to culture in the end.  gapingvoid art We've been helping the small and mighty business, design audacious digital ad campaign projects since 2014.
This isn't about the usual 'online marketing', or 'designing an engaging website', but more like inspiring small business owners and their teams in North Jersey to grow profitable businesses. Whether local or regional ad campaign projects, the growth transformation isn't just digital, but human. The digital tools we use are of no value without great customer service & customer interacting, and the kiss of death in digital transformation through ad campaign projects is when our company &/or business owners believe it is about the tech alone. If you're a small business owner in north Jersey, Contact Us for a free consultation
Which US counties are growing (and shrinking).
 [Source: U.S. Census Bureau] [Source: U.S. Census Bureau]
 Courtesy of Simon Beck AUTHOR Rebekah Brandes Fly above the white peaks of one sprawling French ski resort during winter, and you may catch a glimpse of Simon Beck’s mystical alpine masterpieces: enormous geometric patterns the English artist creates in the snow using a compass and his snowshoes. When he’s not traveling the world to stamp out his complex designs — he’s done so in the United States, Canada, Japan, Chile, and Argentina — Beck, 65, lives at France’s Les Arcs resort. There, on the snow-covered frozen lakes, he makes the majority of his artwork, or drawings, as he calls them. A former cartographer who earned his living designing orienteering maps, he ventured into his current occupation on a whim back in 2004.  Courtesy of Simon Beck “It was just a bit of fun,” Beck told Nice News. “One day, I just wanted to do something after skiing, and I saw this nice little lake outside the building where I live, and it’s about half the size of a soccer field. I just thought, ‘Let’s go and draw a pattern on the lake.’”  Courtesy of Simon Beck When he realized how impressive the pattern looked, something he wasn’t expecting, Beck was encouraged to continue. Fast forward nearly two decades, and he’s coming up on 400 completed snow drawings, each of which typically take somewhere between seven and 30 hours. He’s been commissioned to make snow art for big brands like Corona beer, and multiple apparel companies have featured his designs on items of clothing. He’s even forayed into sand art, making 180 different drawings over the years on one beach in southwest England during the summertime.  Courtesy of Simon Beck So how does he manage to conceive of and execute such impressive, intricate designs? When he started, he drew them on paper before taking the art to the snow. These days, though, he tends to make things up as he goes. To hear him talk about it, it’s clear the process comes rather naturally to Beck, who graduated with a degree in engineering from the University of Oxford before turning to mapmaking.  Courtesy of Simon Beck For example, he casually described the steps he recently took to complete a “very simple drawing.” “I just walked straight across the location, decided where the middle of it should be, and did 10 radii on 45 double paces in length to get the 10 points of a 10-pointed star,” he explained. Next, he paced along each radius, leaving a marker at certain points. “And then I sort of joined up the dots with straight lights, and then drew some triangles around the edge of it in Von Koch’s Snowflake style.”  Courtesy of Simon Beck The design element is far from the most challenging part of the process. “You need a lot of stamina,” Beck said. “I mean, after a big drawing you’re really tired.”  Courtesy of Simon Beck In addition to that stamina (fueled by soup and Coca-Cola), and the simple tools he uses, Beck requires one other element to create his snow art. “I really like listening to music when I’m working in the snow,” he shared, adding: “Indeed, it would be so terribly boring without these personal stereos.”  Courtesy of Simon Beck When asked what tunes he has loaded up on his own stereo, he responded: “Oh, it’s classical music. There’s a little bit of Pink Floyd on it, too.” Click here to follow Beck on Facebook and see many more of his incredible designs. Source: Nice News  The Pudding calculated what place someone is most likely referring to, depending on where they are. The Pudding is a digital publication that explains ideas debated in culture with visual essays.
 In the 1950s, less than 10% of families with children were single-parent. In 2022, among families with children, 31% were single-parent — more than three times as common.

Using AI to detect students' smiles in geotagged photos, Resume.io ranked America's twenty happiest colleges.
There are a few ways to find out which colleges offer students the best experience. You could read each college's reviews and testimonials. You could search a college's name on Twitter for students' brutally honest opinions on studying there. Or, you could do what Resume.io did: use an AI facial recognition tool to detect smiles in Instagram selfies geotagged at different universities, and rank colleges according to the highest proportion of happy-looking faces. After assessing a photo, the AI tool gives a percentage between zero and 100 to indicate how confident it is that the analyzed face is expressing happiness. Resume.io considered faces scoring 75 percent or higher to be genuinely happy ones. Key Findings:
Pork roll, hoagies and farm roads vs Taylor Ham, subs, and eight-lane highways… North and South Jersey are completely different worlds. Here are a few of the biggest differences between the two parts of New Jersey.  1. Pork Roll vs. Taylor Ham For some reason, this is the true dividing issue for most New Jerseyans. In the south, it's Pork Roll. Up north, it's Taylor Ham. Everyone has an opinion, even if they don't eat it.  2. Completely different landscapes... The flat farmlands of south Jersey are a stark contrast to the rocky and mountainous terrain of the northern part of the state  3. ...and completely different traffic patterns. The traffic in north Jersey never seems to cease. Down south, slow country roads generally don't get backed up, but you might be stuck behind a tractor or a combine if you're unlucky.  4. Hoagies...or Subs? This is another terminology debate. Anyone from the Philadelphia metro area calls sandwiches hoagies, but elsewhere, they're known as subs.  5. Each part of the state roots for a different city's sports teams... Philadelphia-area fans are probably the most loyal fans in all of sports, but much of north Jersey roots for the New York teams. No matter who they root for, though, New Jerseyans will always remind you that The Meadowlands is in the Garden State.  6. ... and considered a different city "the City". If your friends are trying to plan a day in "the city", you might want to ask for clarification.  7. Beach vibes vary from the northern towns of Monmouth County to the sleepy towns of Cape May County. Northern New Jersey's shore towns are more residential and lively all year long. Down in the southern parts of Ocean or Cape May county, the population is largely seasonal, and the towns are much quieter.  8. The difference between north and south Jersey is so great that we can't even agree on the "correct" borders.
The "line" between North and South Jersey is determined by where you grew up, and if you consider Central Jersey to be a real thing. There's no true border that we can all agree on. Source: Only in your state |
AuthorContent gathered & updated by the Bergen Review Media team. Archives
May 2024
Categories
All
|

 RSS Feed
|
Vertical Divider
Bergen Review Media was Named Best in Search By TOP SEO's

|
Vertical Divider
|
Vertical Divider

|
WE'RE MORE THAN A MEDIA GROUP
WE'RE PART OF YOUR COMMUNITY |

|
|
Bergen Review Media is a
WebClientReach, llc Company |

50 East Ridgewood Ave. #215
Ridgewood, NJ 07050 Phone: (201) 948-5500 |
The Bergen Review is Bergen county's concierge for the best businesses, restaurants & venues in New Jersey. Our agency has a combined total of over 15 years experience in online media and marketing. Our team of experts scour every nook and cranny of New Jerseys best businesses, restaurants & venues to present to our clients the full scoop of where best deals & experiences are. Even after researching & looking at reviews, finding the REAL scoop on what Businesses, restaurants or venues best fit your interest can be a challenge. Bergen Review Media has a team that researches & visits various establishments. Making sure the consumer gets the best experience.
|
Website by Bergen Review Media